Organisational transformations are not easy, and research has shown that digital transformations are even more difficult. This is why organisations often bring in specialists, such as Growth Matrix, to assist with developing and integrating new technologies, and facilitate adoption and sustainability of the new technologies through a hands-on change management approach.
Through this article, we will explore how organisations are transforming their performance monitoring and reporting to maintain control of increasingly complex operations. Our interest lies mainly in dynamic reports and interactive key performance indicator (KPI) dashboards as diagnostic control tools. We will explore what dashboards are, what they are often used for and why they may be preferable to static reports in Excel or PowerPoint, for example. We will then consider the specific case of one of our mining clients and their experience with a dashboard we developed for them to monitor the performance of their equipment.
Control is a way of mitigating unwanted changes, encouraging desired behaviours, and achieving set goals. There are two types of control – formal and informal. Formal control is rooted in the use of officially documented rules to influence behaviour and outcomes, whereas informal control is hinged on social values and norms. Formal control can be further separated into four subtypes called “levers of control”, namely (1) beliefs systems, (2) boundary systems, (3) diagnostic systems, and (4) interactive systems. Diagnostic systems, our main interest, are feedback systems used to monitor outcomes to keep them aligned to prescribed standards. These are tools used to measure variables, performance, and strategies such as interactive KPI dashboards.
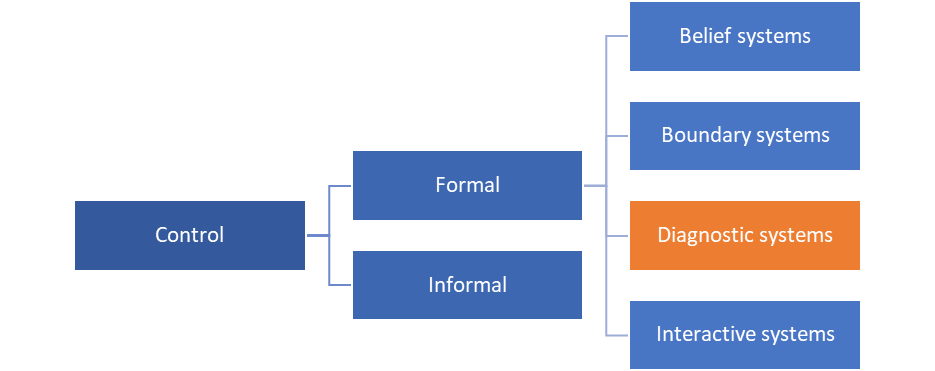
Figure 1: Types of Control / Levers of Formal Control
As organisations seek to create efficiency and advantage, spreadsheet-based control systems are increasingly being swapped out for more advanced systems, which usually have some sort of visual panel. These visual panels are popularly known as dashboards. They are diagnostic control tools used as decision support systems that allow users to assess critical performance indicators on one screen in order to take appropriate management action. Interactive visual dashboards serve as powerful communication tools that can provide comprehensive and accessible reporting to anyone in the organisation.
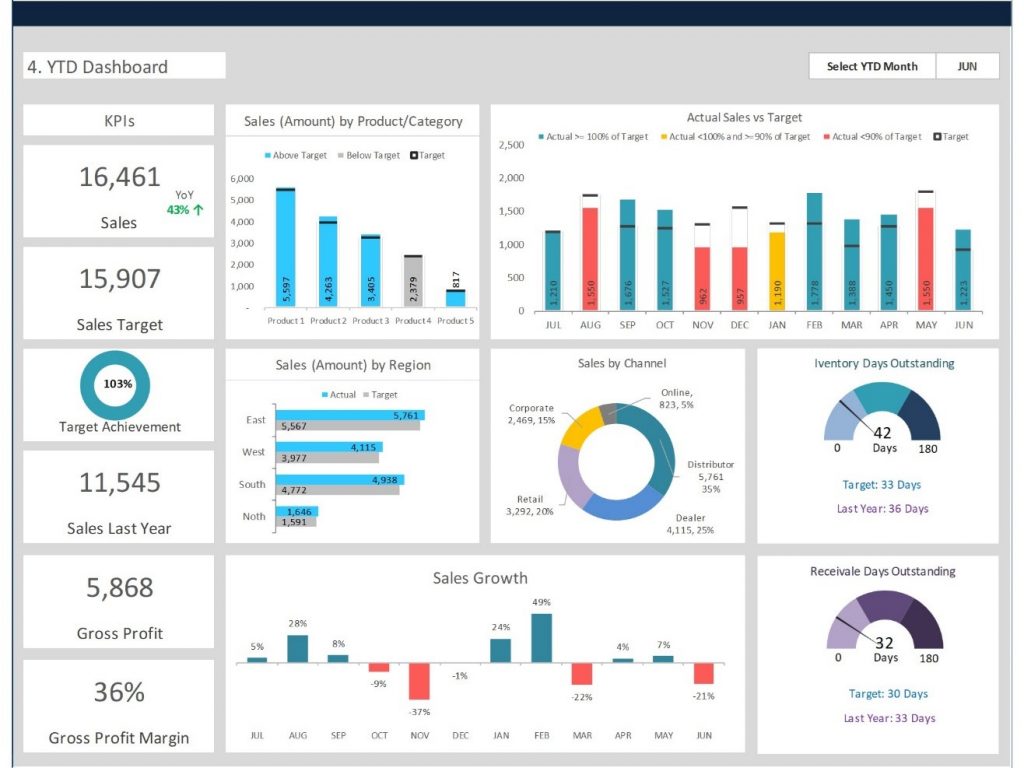
Figure 2: Sales Performance Dashboard (example)
Source: https://www.eloquens.com/tool/z008tyyp/strategy/sales/sales-dashboard-sales-performance-dashboard
Some of the main reasons why users would prefer dynamic dashboards to static reports are that:
- They are far more engaging and interactive, appealing to the cognitive abilities of an individual.
- Dashboards can enable users to have a comprehensive understanding of the performance or status of a monitored indicator at a glance without the need to read long and heavily worded documents.
- They can centralise years of data and reports that may be reviewed simply by employing a date filter/slicer.
- They also make it easy for decision-makers to take quick, well-informed decisions based on readily available data – no need to call so-and-so who checks this-and-that with such-and-such before they can give feedback after a week.
- If the right type of data is available, and the dashboard is refreshed frequently enough, users are able to see near real-time performance reports. Once published, users may access a dashboard from various digital devices with an internet connection, making these highly convenient.
Growth Matrix recently developed an Engineering Equipment Performance Dashboard for a large mining client in Botswana. Engineering equipment is the lifeblood of a mining company. The management of assets is one of the top three KPIs in any successful mining venture. The client historically used various Excel-based reports to provide performance information from its operations sites to a manager in the head office, who then collated this information into one PowerPoint presentation which he used to report within the Engineering department and to external stakeholders. Not only was the old reporting process labour intensive and time consuming, it also increased the risk of data quality issues. The reports were not centralised or standardised, and often previously published results were contested by data providers.
The client tasked us with creating a reporting system that would address the following issues:
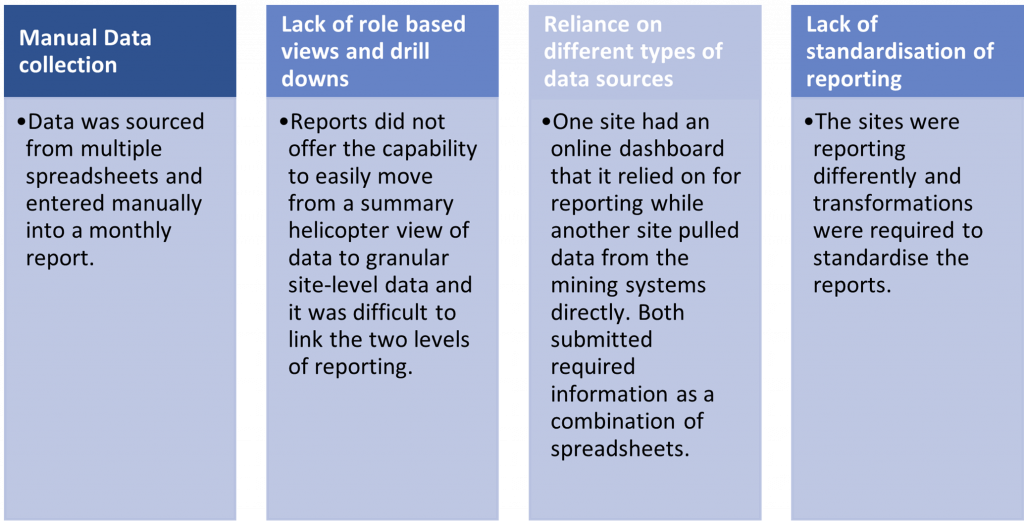
Figure 3: Client Challenges
An agreed key outcome of the assignment was to create a system that would enable the client to derive insights on equipment performance and the impact of asset management tactics through more robust tracking of key metrics. The solution would reduce manual data collection for reporting, reduce handling of data by multiple people, therefore, eliminating the resultant issues of data inaccuracy, multiple incoherent data sources, a lack of role-based views and drill downs and a lack of standardised reporting. The dashboard was the first phase in a two-phase initiative that will transform the Engineering department’s decision making from largely reactive to proactive.
The success of this endeavour has resulted in the early detection of (potential) issues and their resolution before they became significant problems.
The Growth Matrix Decision Modelling & Analytics team successfully delivered the desired product using a combination of Microsoft applications tools:
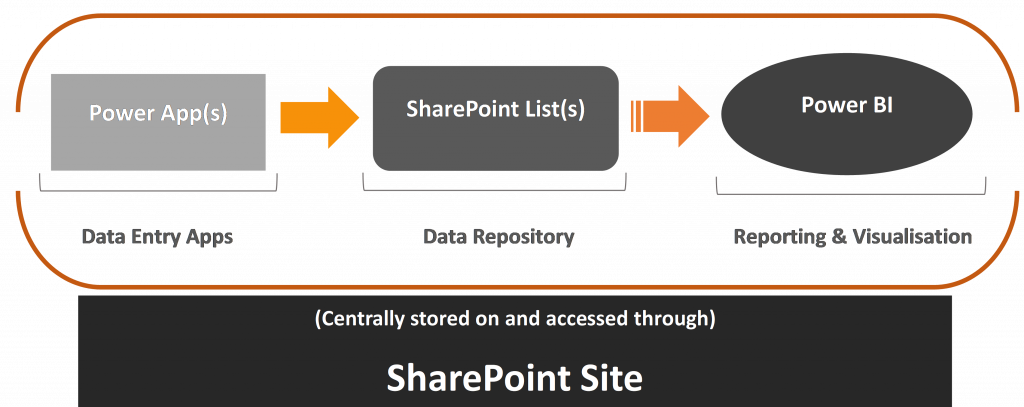
Figure 4: Data flow on Microsoft applications used in project
The poetry of using Microsoft tools and applications is that most organisations already have access to them as part of their corporate Microsoft Office subscriptions. Most are underutilised because clients are unaware of their potential. Using them translates to lower development costs for the client, full control of the final product, and inherited security settings of all applications. One main disadvantage of using Microsoft tools is that they are often not fully, or easily, customisable and one is limited to customisation within their prescribed parameters. However, with a good developer who has a sharp sense for creative design, this is a negligible problem.
The Equipment Performance Dashboard we delivered was widely accepted across the organisation (even outside the Engineering department) because it specifically addressed some of the client’s main pain points and directly spoke to their corporate strategy. Many organisations embark on similar journeys only to end up with dashboards that are “cool toys” with a myriad of features, but with no real impact on the client’s real issues. Other reporting systems are based on captivating concepts which are impractical in the client’s specific context and end up not working as initially intended, leaving clients with costly white elephants and no real return on investment. Growth Matrix’s approach focuses on understanding the client, the nuances of their problem and their requirements and providing a fit-for-purpose solution. There are many seemingly complex organisational issues that do not require an expensive ERP or “best practice” solution to resolve.
The client confirmed that the dashboard has been instrumental in assisting them reach their performance goals, mentioning the following as notable benefits of using the tool:
- The dashboard facilitates easy understand of organisational performance.
- There is improved tracking of key performance indicators because of the dashboard.
- Storing data is much easier and the reporting process is less tedious.
- Important performance information is centralised, making it easily visible and available, therefore, enabling quick rectification of issues before they get out of hand.
- There is less human error in reporting.
Through our Decision Modelling & Analytics service, our team of professionals develops the most effective tools by leveraging the right technologies for your business context. We believe in the custom creation of for-purpose solutions for individual clients. We often exceed client expectations with our products and make sure that we avail the necessary support to enable clients to fully own and utilise what we develop for them. A solution is only as valuable as the impact it makes in the way of addressing the problem it is meant to solve. This requires good change management skills, which we embed into every service we offer. Find out more about our services and get in contact with us today!
Growth Matrix Solutions – The Intelligent Choice
Right here is the right blog for anyone who would like to understand this topic. You realize so much its almost hard to argue with you. You certainly put a brand new spin on a subject thats been discussed for years. Wonderful stuff, just great!
I have to thank you for the efforts youve put in writing this blog. Im hoping to check out the same high-grade blog posts by you later on as well. In fact, your creative writing abilities has encouraged me to get my own website now 😉